Progress Grid
TransLution supports a grid to allow users to see a scanning history. This is called the Progress Grid and it is supported on all three clients - EazyScan, EazyTouch and Android.
When defining a function area, if you want to show a progress grid, you must select the two options highlighted below. The progress view is a custom built view.
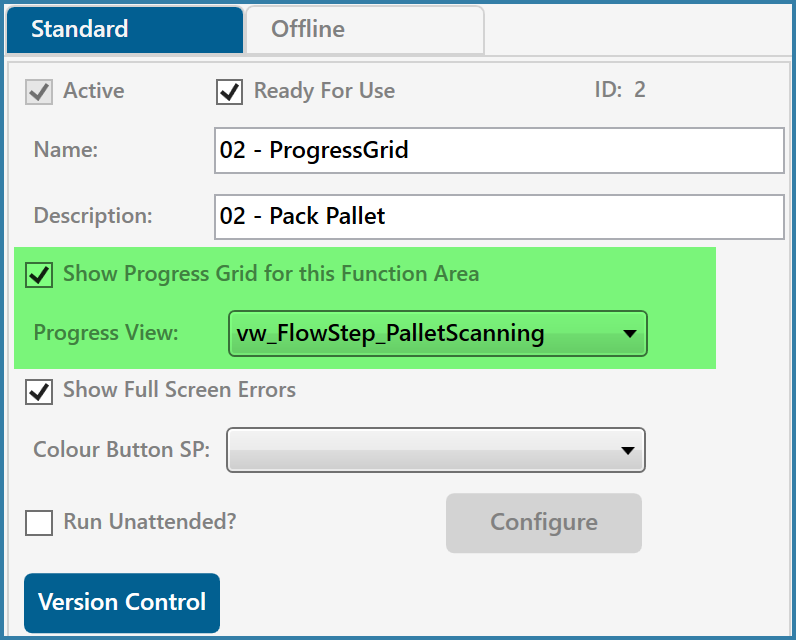
Setup to show Progress Grid
Defining the Progress Grid View
The data shown in the progress grid is determined by the name of the view specified above. The key requirement when defining this view is that the first 2 columns of the view MUST be an ID column and another column with the scanner job ID. This is what core TransLution uses to determine which rows of data to show and which not. These two columns are not displayed on the form.
There are really only two tables that would be used to show data in the this grid - the scandata table makes the most sense since it allows you to show rows of data. The core flow step processed data can also be used but it would show each scan one below the other. A sample view is shown below and then the form with the grid is shown too.
Sample View
Note how the the view contains both an ID and a JOB_ID column. It is a good way to sort the data. The result on the EazyTouch form is shown below.
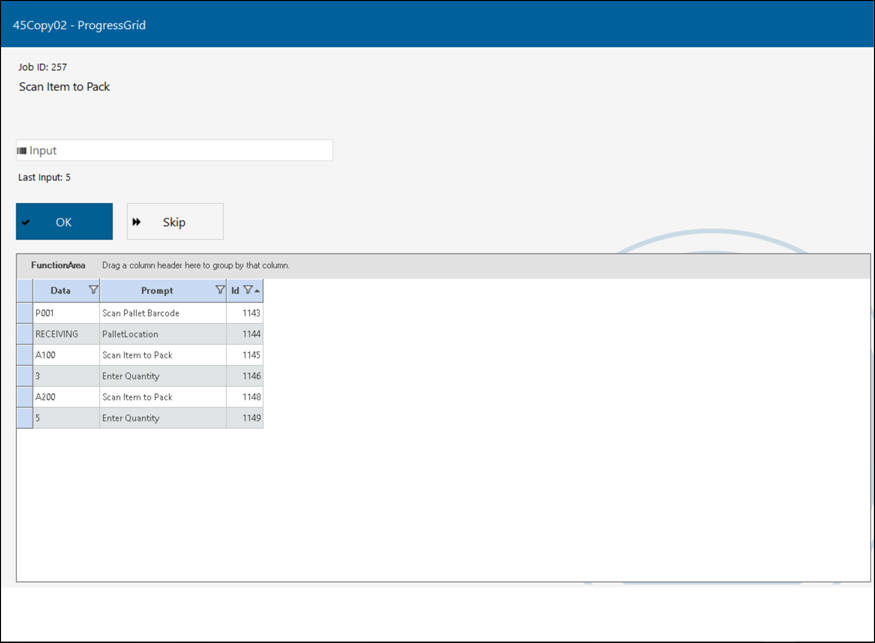
Progress Grid on EazyTouch form
On EazyScan and Android, the grid is not always visible but if the grid has been enabled, a button called Progress is available which will then show the grid. Note that on EazyTouch it is possible to group and sort the data in this grid.