Charts
Charts are only support on EazyTouch for Windows. An example of a chart is shown below.
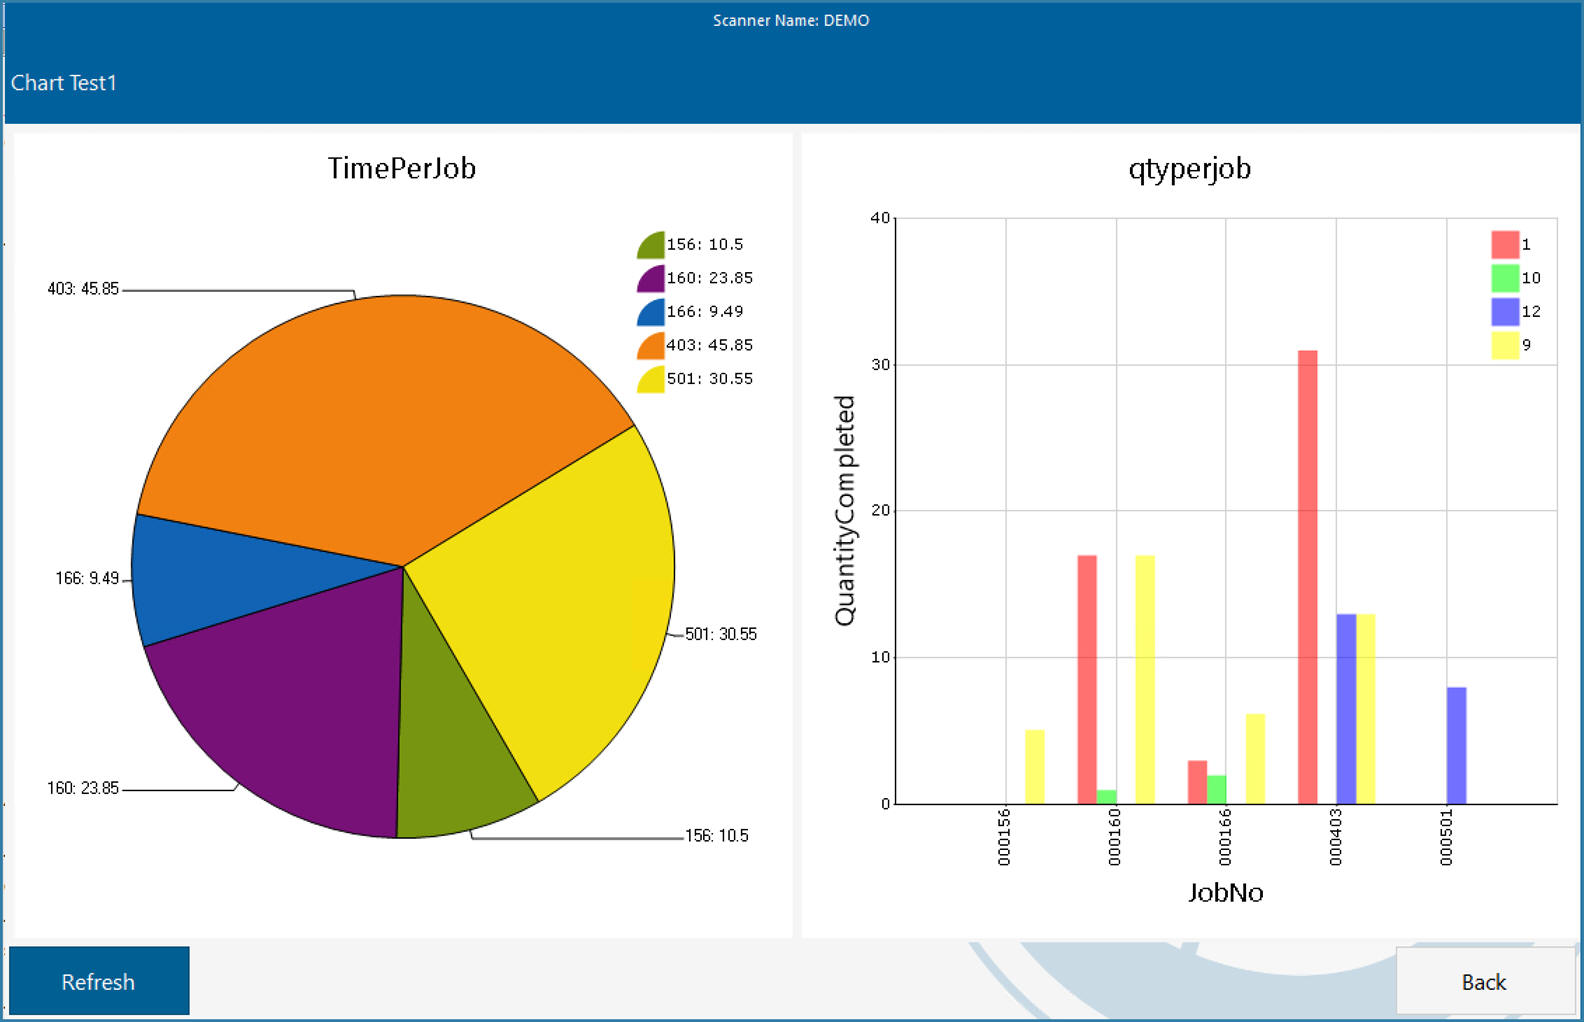
Chart Overlay
Chart overlays are defined on the same form as standard flow step functions on the Application Control - Function Step Maintenance form. On that form right most panel select the Overlay option as shown below.
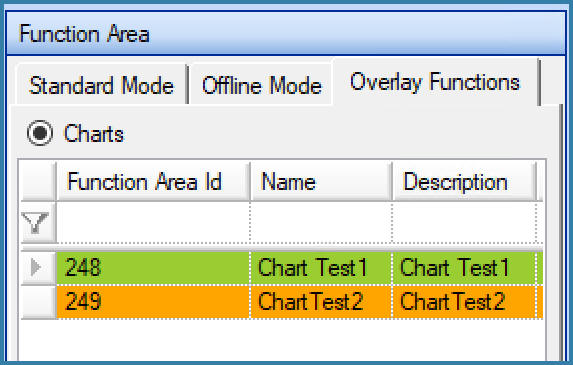
Chart Maintenance option
You can then define a Chart function area in nearly the same way as you define any other function as below.
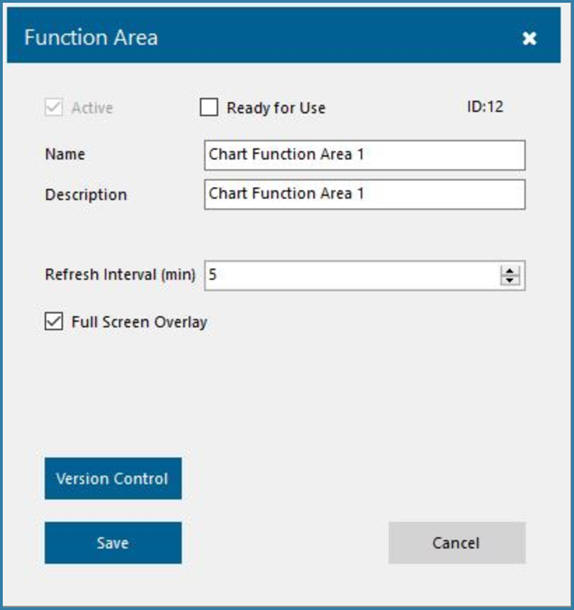
Creating a Chart Function
The Name, Description and Ready to use fields are the same as for normal step functions as is Version Control.
The Full Screen Display option displays the chart without configurable buttons at the bottom of the form and with no RHS panel for numeric keypad and other functions.
The refresh interval in minutes controls how quickly the chart refreshes. This is the default refresh rate for the function area. You can also specify a different refresh rate for each device with permissions to view the chart function area. '0' means no auto refresh
The next step is defining the details of the function. If you select a chart type function area the central panel will look like this. Until you have defined the chart details the preview area shown below will be blank.
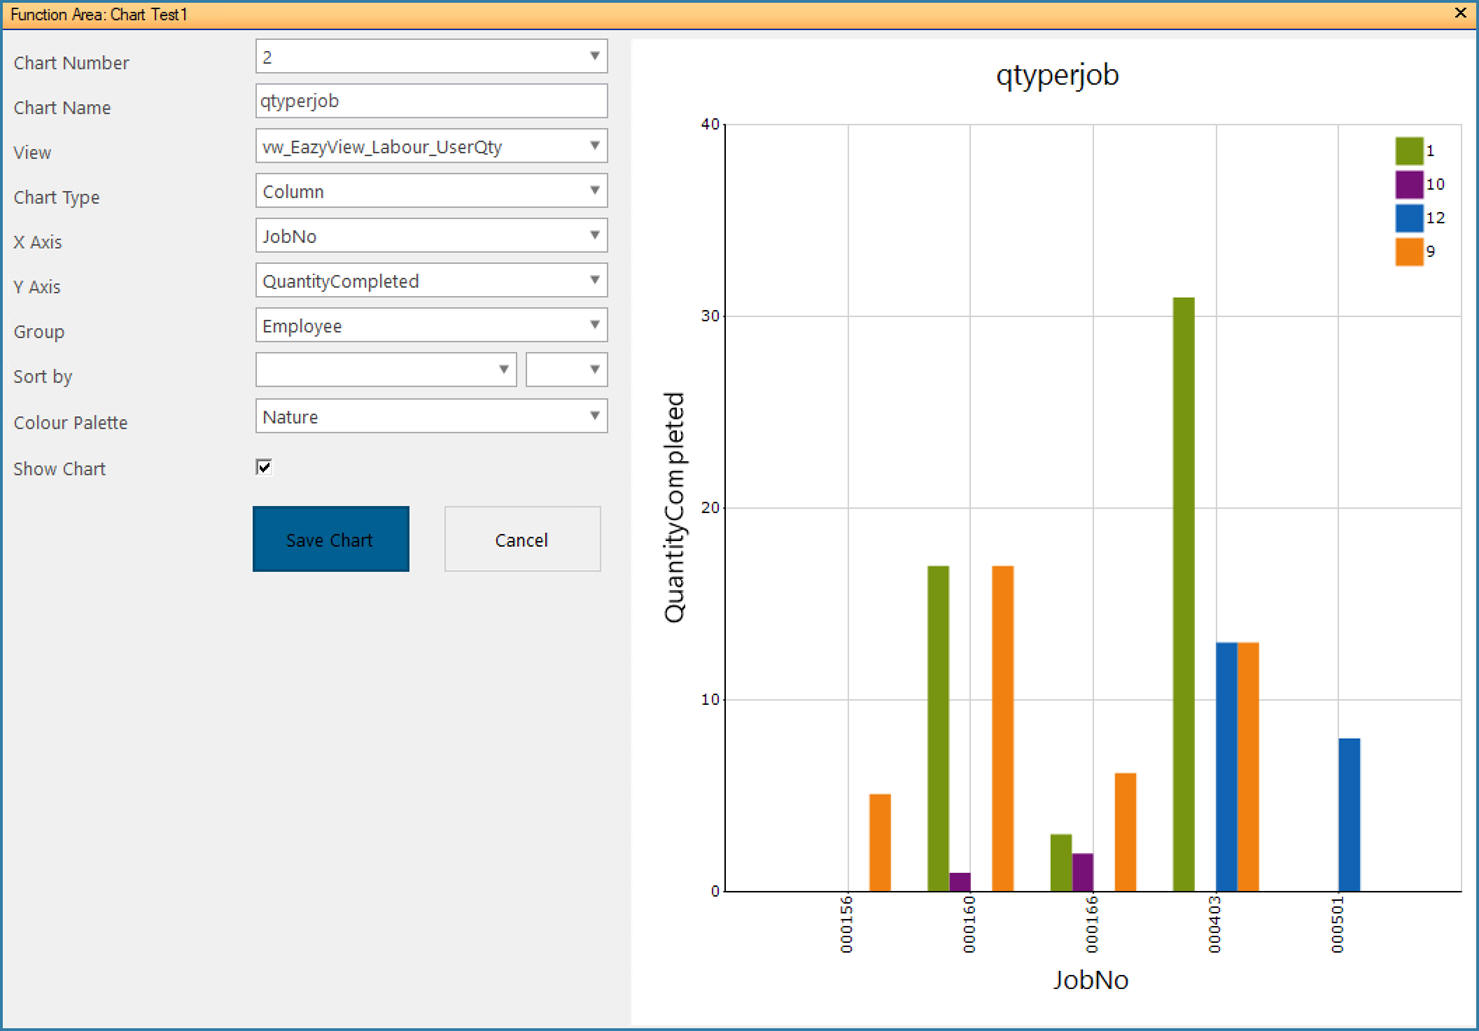
Chart Definition and Preview
The Chart Number can be 1 or 2. Each chart overlay supports a maximum of 2 charts. One chart will use the whole form and two will share half the form each.
The Chart Name is the text that appears above the chart and the view is the view used as source data to the chart.
Chart type is Column, Bar and Pie which are the currently supported chart types
X and Y axis for a bar chart define the X and Y axis column data while the group by column allows for data to be grouped as shown above.
It is possible to sort data in the X axis by one of the fields in the view and we have a few colour palette options available.
The Show Chart button is simply a way to hide a chart that was defined on a function but is no longer required.
Once you click on Save you will see a preview of the chart to assist in determining if this is the correct setup or not.
Some more information about Charts:
- You can define custom buttons on chart functions. No data is passed to the button but it will execute
- Charts can be added to workflows and given device permissions in exactly the same way as any other function.